March 28, 2019
How many sensors should I use in a temperature mapping study?
Written by:
livesinternational
Date:
March 28, 2019
Comments:
No Responses
Well, although there is no predicate rule establishing the amount of measuring sensors to be used when mapping a volume, there is guidance to help you determine sensor amount and placement.
Guidance is available from The International Society for Pharmaceutical Engineering (ISPE), the World Health Organization (WHO) and the United States Pharmacopeia (USP), among others, as listed at the end of this article. This article summarizes them for you.
Commercial-off-the-shelf freezers, refrigerators, incubators and environmental chambers
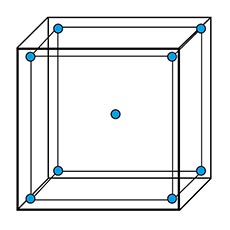
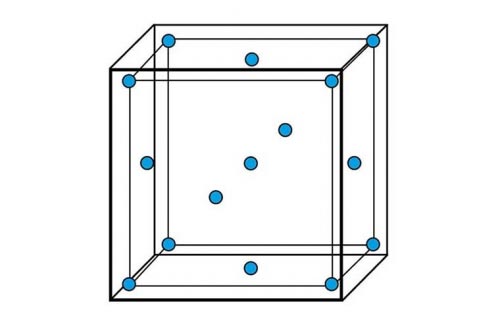
Figure 1 – Recommended sensor placement for internal volumes up to 2 cubic meters
Use 10 temperature sensors in chambers with internal volume up to 2 cubic meters. Place 9 sensors within the usable volume. Figure 1 suggests sensor placement. place an additional sensor near the probe of the device that monitors and/or controls the system.
Why is this? You are mapping worst-case locations under the assumption that any other location contained within the usable volume will not experience temperatures exceeding these extremes. The corners represent the intersection of the most planes (3) that are exposed to outside air temperature. Also, corners tend to have the least air circulation. Therefore, each corner represents a potential worst-case location. Conversely, the center of the usable volume is farthest from the outside air. it is also most likely to have good air circulation. Likewise it represents a potential worst-case location.
Together, these locations are most likely to experience temperature extremes. Include a rationale in the temperature mapping protocol to explain all assumptions.
Use 16 temperature sensors in chambers with internal volume up to 20 cubic meters. Place 15 sensors within the usable volume as recommended in Figure 2. The extended lenght of the sides in bigger chambers makes the center of each place a point of interest since its temperature might differ significantly from that of the corners. This is due to its proximity to the center of the usable volume. Place an additional sensor near the probe of the device that monitors and/or controls the system. This will be needed to to determine alarm and control offsets by correlating temperature differences between these locations and the worst-case locations identified in the study.
Warehouses, cold rooms, walk-in freezers and walk-in refrigerators
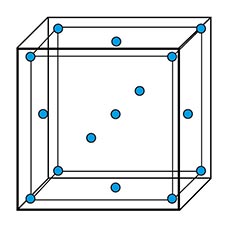
Figure 2 – Recommended sensor placement for internal volumes up to 20 cubic meters
Distribute sensors in a grid format every 5 to 10 meters along the width and lenght of the area3. For very large facilities, sensors can be placed up to 20 or 30 meters apart. At each point on the grid, arrange additional sensors vertically forming layers. Use three layers for rooms each point on the grid, arrange additional sensors vertically forming layers. Use three layers for rooms with ceiling up to 3.6 meters. Consider adding more layers for rooms with ceiling above 3.6 meters. Place an additional sensor near the probe of the device that monitors and/or controls the HVAC. Map product storage areas only. Provide rationale if adding sensors in the other areas of interest. Temperature mapping should consider other factors that may contribute to temperature variability such as the size of the space, location of HVAC equipment, sun-facing walls, low ceilings or roofs, geographic location of the area being mapped, airflow inside the storage location, temperature variability outside the storage location, workflow variation and movement of equipment (weekday vs. weekend), loading or storage patterns of product, equipment capabilities (e.g., defrost mode, cycle mode), and operating procedures.
Bibliography:
- 1 – ISPE (2016). Good Practice Guide: Controlled Temperature Chamber Mapping and Monitoring.
- 2 – USP (2018). USP41-NF36 <1079>. Good Storage and Distribution Practices for Drug Products.
- 3 – World Health Organization (2015). Technical Supplement 8 to WHO Technical Report Series, No. 961, 20111. Temperature Mapping of Storage Areas.
Read this article in Japanese “温度分布測定には、何点の温度センサーを設定すればよいでしょうか“.
Translated by Miki Izumisawa.
Popular blog posts
How to use real time high temperature data logger in depyrogenation tunnels
The High Temperature Data Logger GMP5F RF HT created by Lives International eliminates the issues related with using thermocouple cables in the depyrogenation tunnels. GMP5F...
Read MoreBest practice of using lives international data loggers for SIP cycles with smart gaskets
Lives International both wireless data loggers and standard data loggers can be used in SIP cycles. We use Smart Gaskets to insert the data logger...
Read MoreHave a look into the future of Thermal Validation
Have a look into the future of Thermal Validation - come visit Lives International at Interphex 2021 in NYC, booth 2036 To celebrate the return...
Read MoreLives International expands into new service facility in USA
We are delighted to announce the opening of our new service department in York, PA. This expansion is the result of unprecedented growth in sales...
Read MoreReal Time Wireless Data Logger for Ultra-Low Freezers Validation
Real Time Wireless Data Logger for Ultra-Low Freezers Validation - Down to -120°C
Read More